 New Features in Version 9.3
Free Trial
The latest version is featured here: Version 10 Enhancements
Highlights
Sentinel Visualizer Version 9.3 is a significant update from Version 9.0 with many enhancements.
- New Saved Visualizer Options
- Merge Multiple Visualizers into One
- Directional Totals on Relationship Lines
- Improved Management of Multiple Networks in Your Diagram
- User Interface Improved for Get Links Between Entities
- Entity and Relationship Search Criteria can be Saved and Retrieved
- Visualizer Map Improvements
- Visualizer Timeline Enhancements
- Specify Advanced Date Formats on Import
- Performance Enhancements
New Saved Visualizer Options
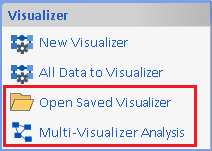 You can save your link analysis diagrams for future use and share with your team. Version 9.3 adds new menu items on the Home Page and Visualizer menu so you can open
and analyze your saved Visualizers.
Open Saved Visualizer
Select one or more saved Visualizers and open each in their own window. Or select multiple Visualizers and merge them into one.
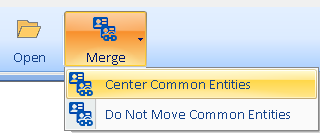
When you select two Visualizers, you can merge them and optionally center their common entities between them:
Multiple Visualizer Analysis
Every saved Visualizer can represent considerable effort to select and discover the entities and relationships in a particular situation. Version 9.3 lets you analyze across your saved Visualizers for hidden common entities.
For instance, each saved Visualizer may represent a crime scene at a particular location and time with its associated suspects, cell phones, license plates, bank accounts, etc. Quickly detecting the same people and other evidence at multiple crime scenes help prioritize what to investigate.
Multiple Visualizer Analysis lets you quickly find
- Entities in all the selected saved Visualizers.
- Entities ranked by how many of the saved Visualizers they are in.
You can create and save link analysis diagrams. Now you can merge them into one with an option to center the common entities.
For instance, start with two separate saved diagrams:
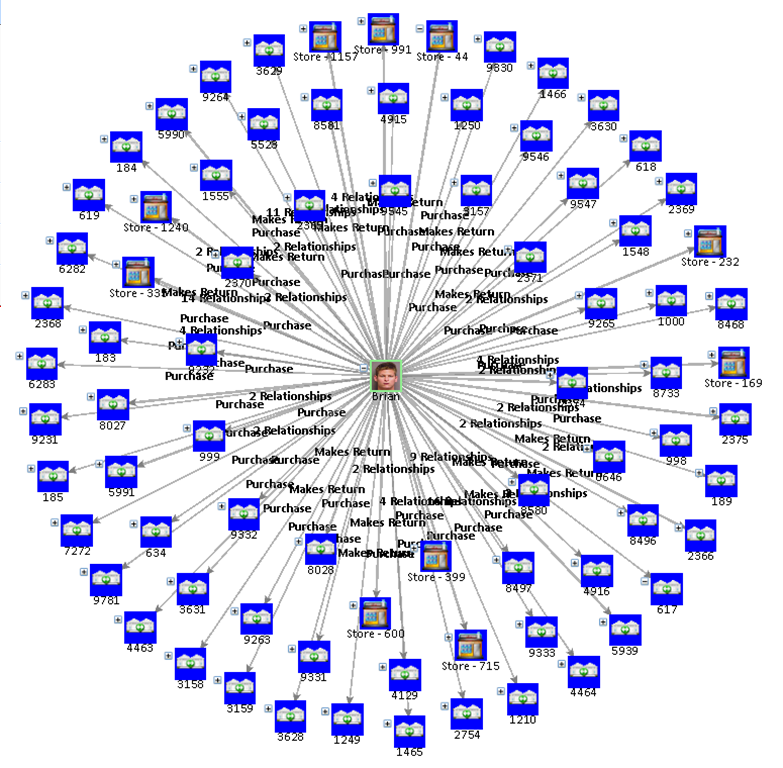
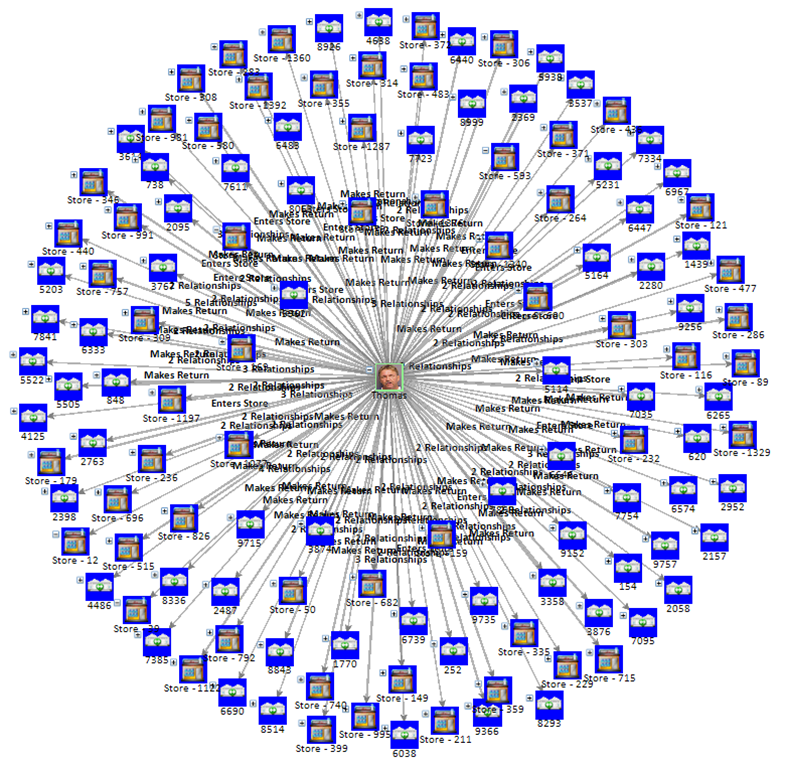
Combine Two Diagrams without Moving Entities
Diagram 2 is Added without Moving the Common Entities Already Displayed in Diagram 1
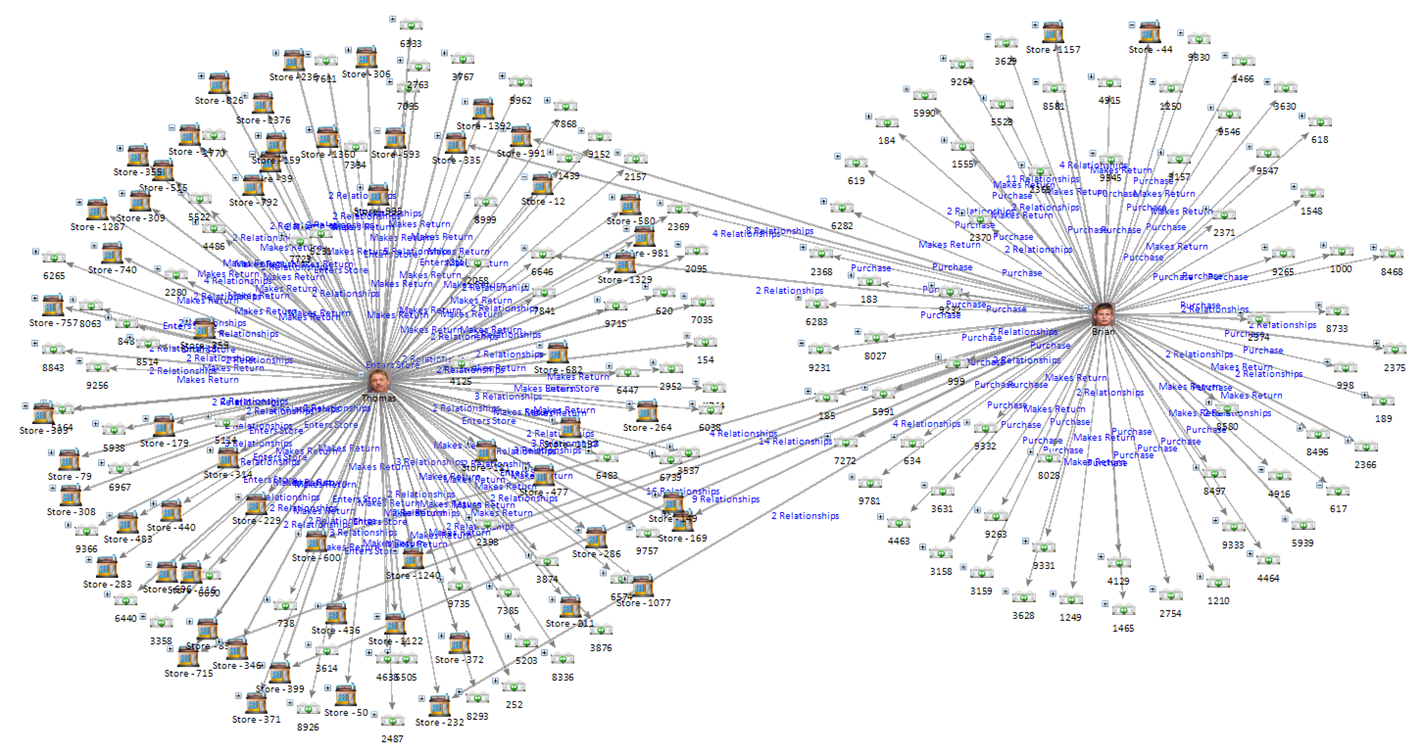
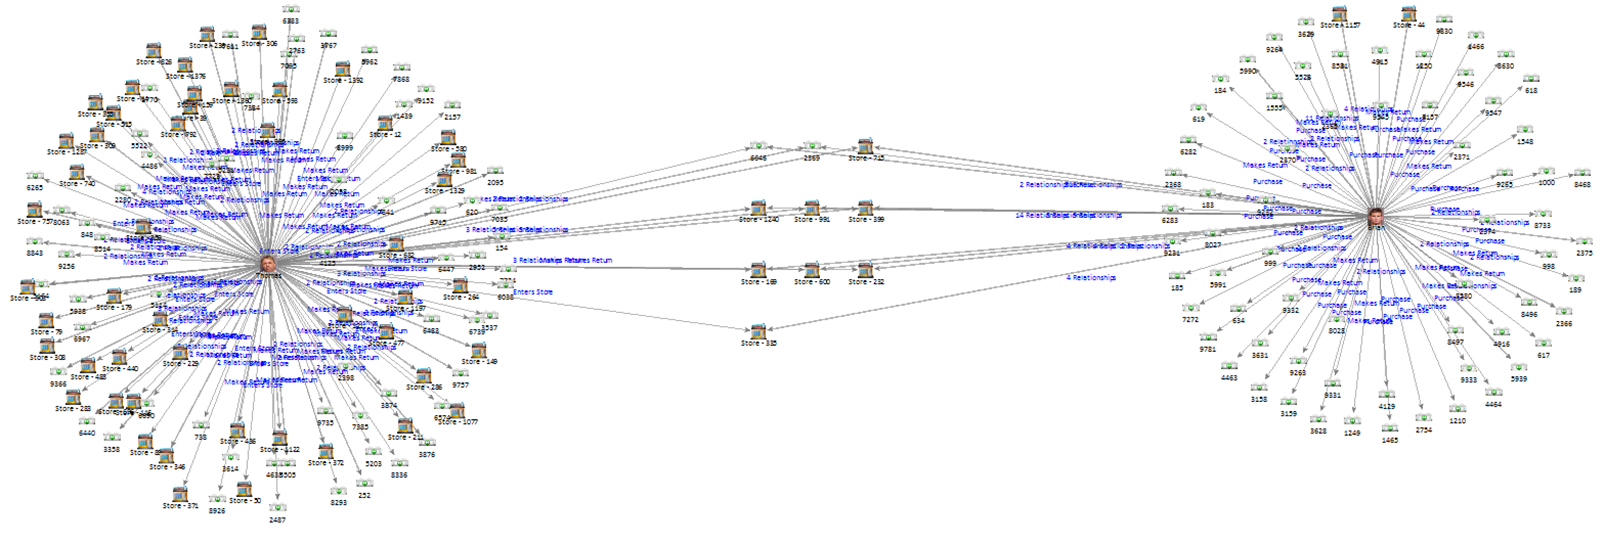
Combine Two Diagrams with Common Entities Centered Between Them
Quickly see the entities common to both diagrams.
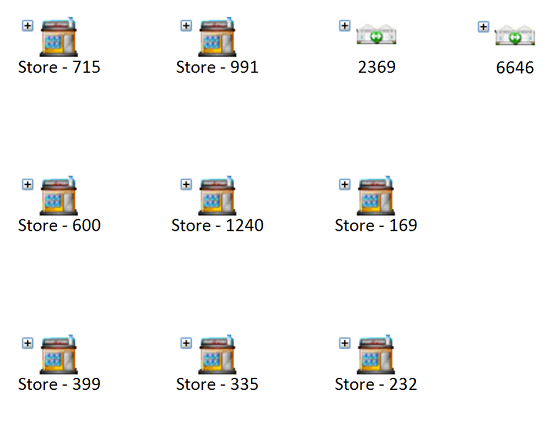
Only Display Common Entities Among Multiple Diagrams
You can also choose to display the entities that are in all the selected diagrams. This powerful feature quickly identifies commonality among similar events such as multiple crime scenes.
There is a new option to show the values for relationship lines based on direction. Lines can represent multiple relationships or transactions with different directions. The sum of their values could already be displayed. Now, see the directional flow for each line such as money transfers.
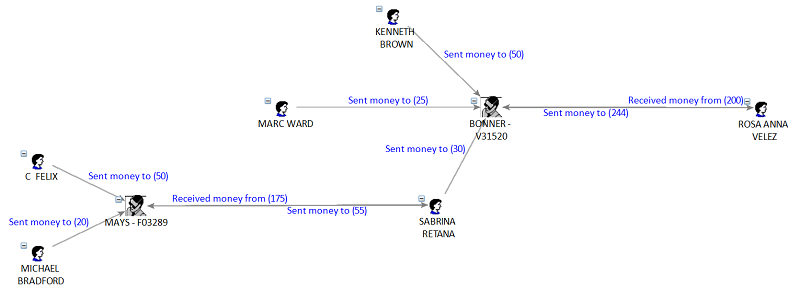
A network is a set of entities connected through their relationships. Your diagram may have one large network or more smaller networks. If there are no relationships, each entity is its own disconnected network.
Version 9.3 addresses some issues related to multiple networks on your Visualizer diagram..
Social Network Analysis (SNA) Values for Each Disconnected Network
Previously, SNA values were not calculated if there was more than one network. Now they are calculated for each network separately.
SNA values such as closeness, betweeness, authority, hub, etc. should only be compared within a network and not between them.
Layout of Geometric Options Applied to All Entities when there are No Relationships
The geometric layouts automatically reorganize your entities into shapes such as circles, spirals, squares, rectangles, triangles, etc. A shape is generated for each network.
If there are no relationships (every entity is its own disconnected network), all the entities are treated as one networks and put into the specified shape.
Get Links Between two or more entities is a powerful way to find connections among your selection. Sentinel Visualizer analyzes your database to find the family of entities and relationships related to your selection and adds them to the diagram.
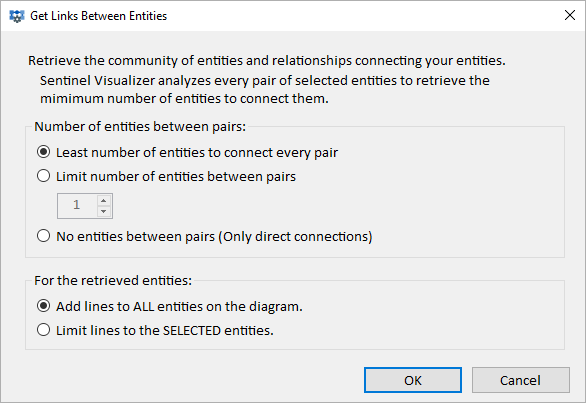
Sentinel Visualizer examines every pair of entities in your selection to see how they are most closely connected. If 2 entities are selected, there's only 1 pair. 3 entities have 3 pairs, 4 entitles have 6 pairs, 5 entities have 10 pairs, etc.
You can specify how many entities to retrieve between pairs by making sure every pair is connected, limiting the number of entities to add between them, or only adding relationships without adding any entities.
When entities are added, you have the option to add their relationships to all the entities on your diagram or just the selected ones.
Sentinel Visualizer offers powerful Database Search features. A wide range of search criteria can be specified for finding entities and relationships. They can be set under Entity Search, Relationship Search, Advanced Dataset Builder and Data Refinement while in the Visualizer diagram.
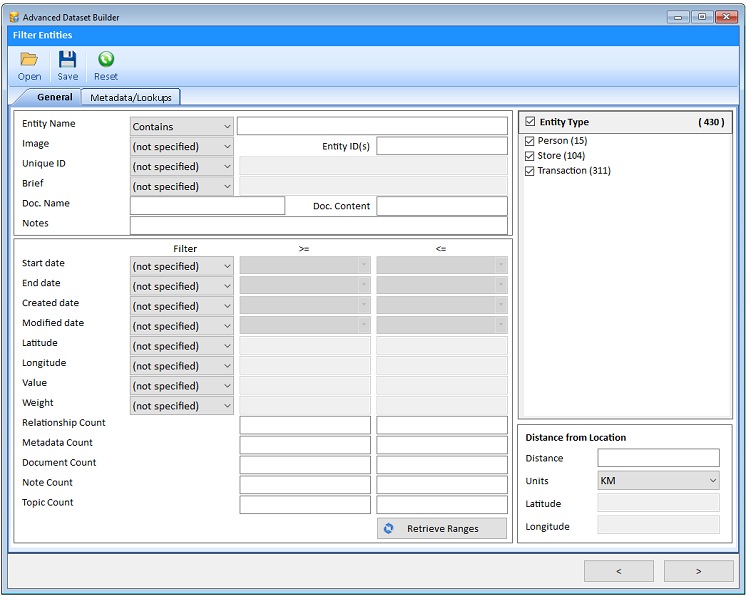
The criteria you enter in any one of them can be saved and retrieved for any other to eliminate the need to re-enter your selections. Saved in the database, they can also be shared with other members of your team to simplify their searches.
Maps have a toolbar with new buttons to improve the geospatial experience.

New Buttons
- Zoom Box lets you draw a box and have the map zoom to that rectangle,
- Fit to Page automatically displays the smallest area to see all your data.
- Geo-Query lets you search your data based using a rectangular area you draw or a circular area around a point.
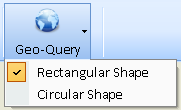
- Keep lets you select the entities to keep but remove all of the other entities.
The Visualizer shows the link chart on the Diagram tab, and temporal data on the Timeline tab. If your relationships have start and end dates, they are displayed on this tab.
The Timeline has these enhancements:
Entities are Displayed
Entities with start and end times are displayed. Previously, only relationships were displayed.
Export Timeline Data to Excel
Timeline data can now be exported to an Excel file.
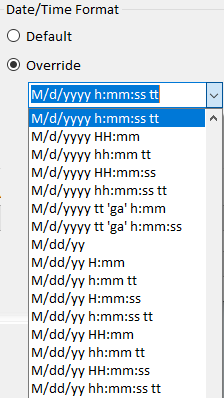
Importing date time data is simplified by letting you specify a wide range of non-standard date/time formats that your data source may be using.
Previous Versions
- New features added in Version 9.0
- New features added in Version 8
- New features added in Version 7
- New features added in Version 6
- New features added in Version 5
